The FleetAdvance Dashboard (iConnectData > FleetAdvance QuickLink >Dashboard) offers an overall view of your company's performance by individual account and customer ID. Key features and benefits of the dashboard include:
- Total fuel spend for that date range.
- How much drivers are saving by going to cheaper fuel stops.
- How many drivers are overspending by going to more expensive fuel stops
- Total gallons broken out by Diesel and Gas.
- Average price per gallon by Diesel and Gas.
- Transactions are by network, Mastercard, and Comdata Network.
The FleetAdvance Dashboard provides a simple snapshot of your fleet's performance, which can help you make better fueling decisions.
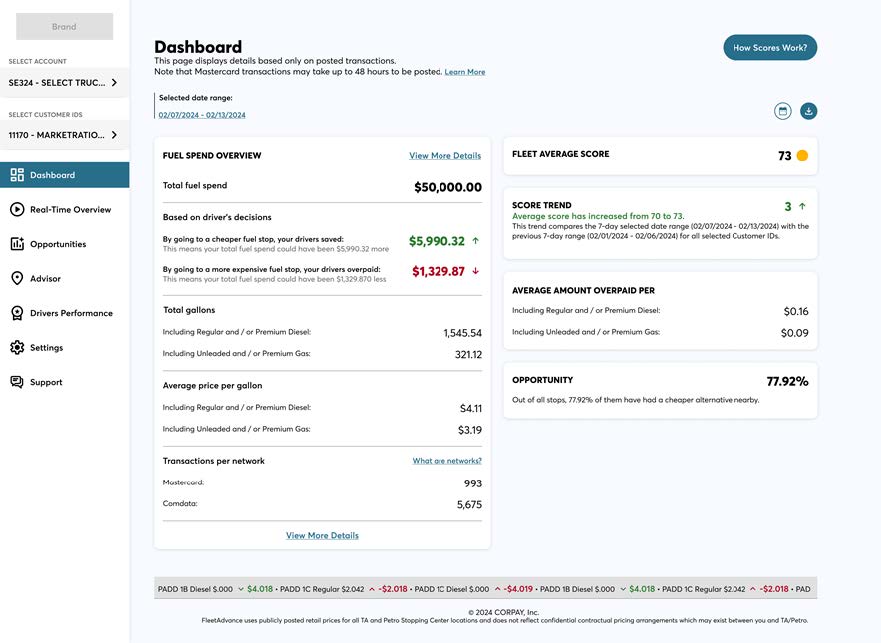
You can select what accounts you want to see, if you have access to more than one account, and which customer ID’s by choosing the arrows on the menu bar.

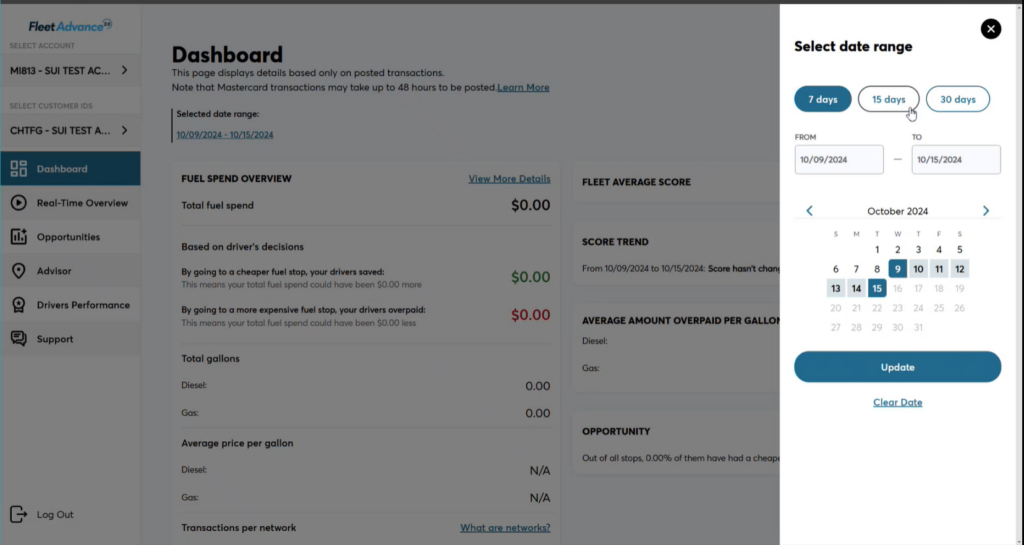
Select your date range. The default date range is the past 7 days. You can change it to 15 or 30 days or customize it. During our initial release, you can only pull up to a 31-date range at a time.
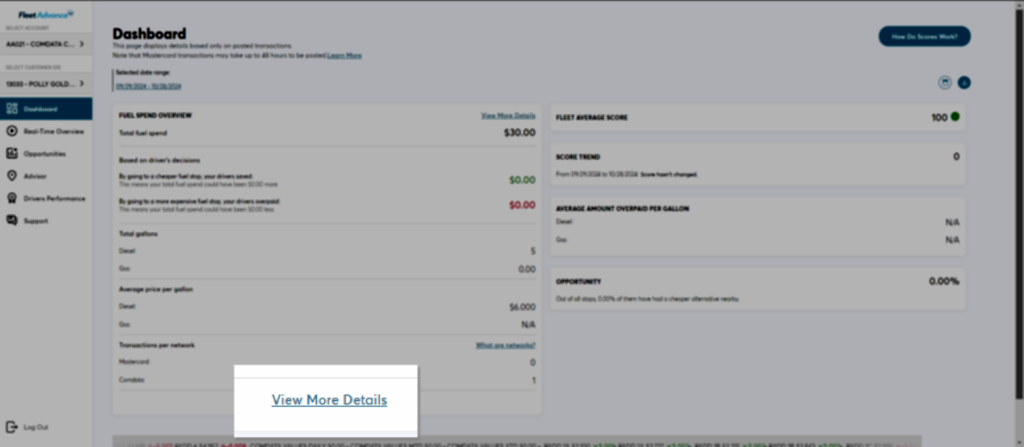
To View More Details, you can select View More Details to see a table view of the fuel spend overview and a list of drivers with the transaction score.
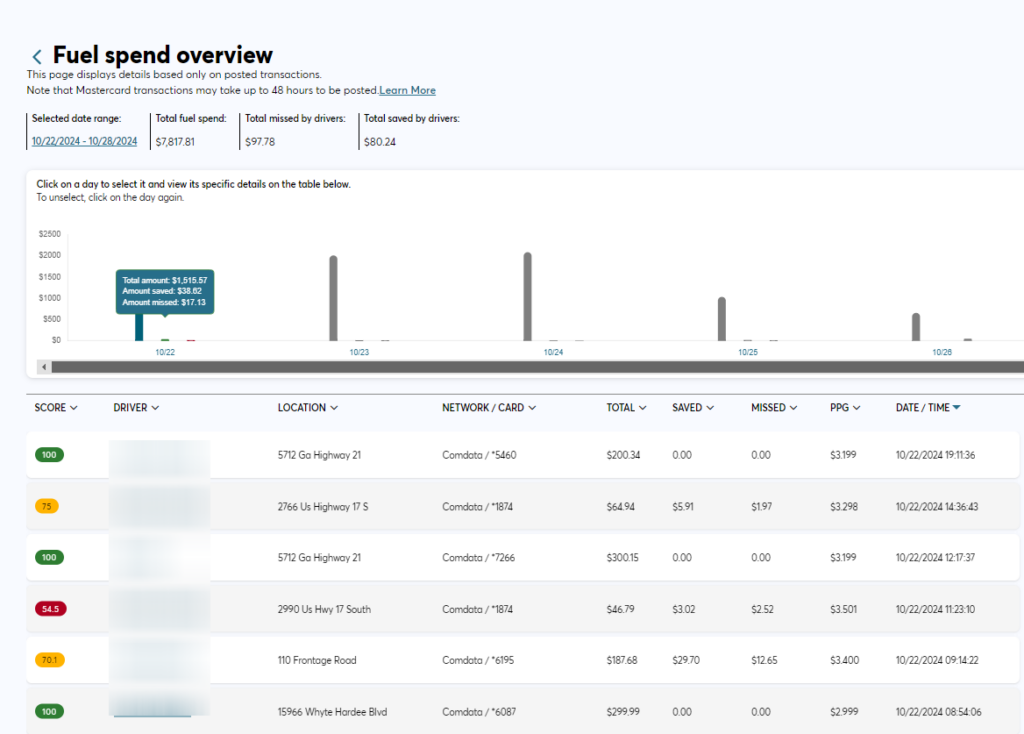
Fuel spend overview includes a bar graph report in the top section that shows daily spending. You can click on the bar for more information on that day. The bottom sections show line item details with driver information and score for each transaction.

You can download this report by clicking the button in the upper right-hand corner. It is an Excel report summarizing total fuel spend, savings, and missed fuel transactions for that date range.

Sample Download Report
Transaction details
Selecting a transaction by a driver allows customers to see the transaction details and suggested alternative fuel locations. The alternative location information includes the station’s name, address, and the distance from the location where the transaction took place. This information is also visible in a map view.
New! The suggested alternative fuel location information is available on past transaction details and transactions on the real-time overview screen.

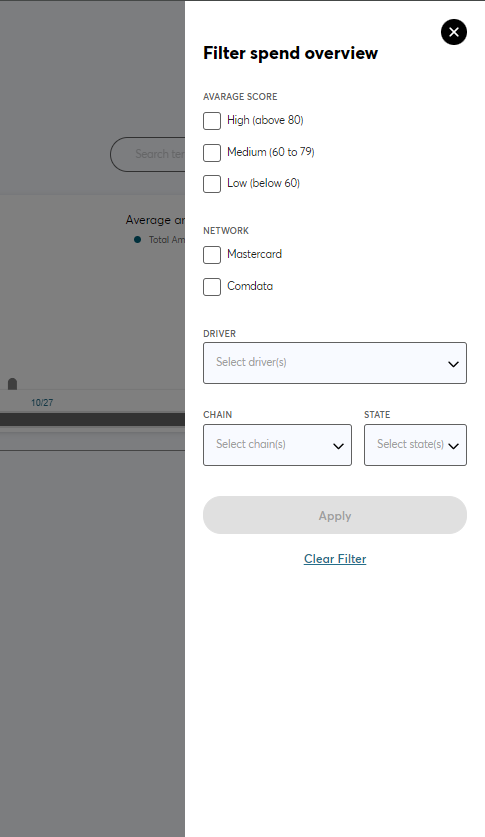
Filter Option allows you to filter the spending overview by high, medium, and low average scores, Comdata or Mastercard network, by driver, chain, or state.
Fleet Advance Score is the average score across all the transactions for the selected date range. It is based on a scale of 1 to 100.
Score Trend shows how your points have gone up or down. This field compares the previous time period for the selected date range.
The Average Amount Overpaid per gallon for Diesel and Gas, segmented by Diesel and Gas, shows the potential savings and the amount per gallon if cheaper fuel was purchased.
Opportunity is a percentage of all the fuel stops with a cheaper alternative nearby? A lower score indicates that your drivers are fueling at the cheapest fuel station in the area. For example, if the percentage was 50%, half of the transactions for that date range could have purchased cheaper gas and fuel locations nearby.
FleetAdvance Ticker is a retail average price monitor. The ticker displays the average regular and diesel fuel prices for each Petroleum Administration for Defense District(PADD) for the previous day. It also indicates the price movement up or down from the day before, indicated by a red arrow. For example, if the current day is Wednesday, the ticker will show PADD pricing from Tuesday and the up-and-down fluctuation from Monday.
The ticker also displays your Comdata fuel savings for the current day, the month-to-date (MTD), and the year-to-date (YTD). This will help you track your fuel saving goals.